September 11, 2025
Market Outlook: Navigating The Macro Headwinds
I. Market Psychology and Technical Structure
The current market trajectory confirms our recent thesis. A strategic pivot was initiated near the $116,000 level, and since then, Bitcoin has retraced by 8%. This decline, however, is merely the preliminary phase of a more significant correction. Key on-chain metrics reveal a market still devoid of true fear, as the aggregate of unrealized losses remains negligible at just 0.5%. For comparison, major corrections historically involve figures exceeding 30%.
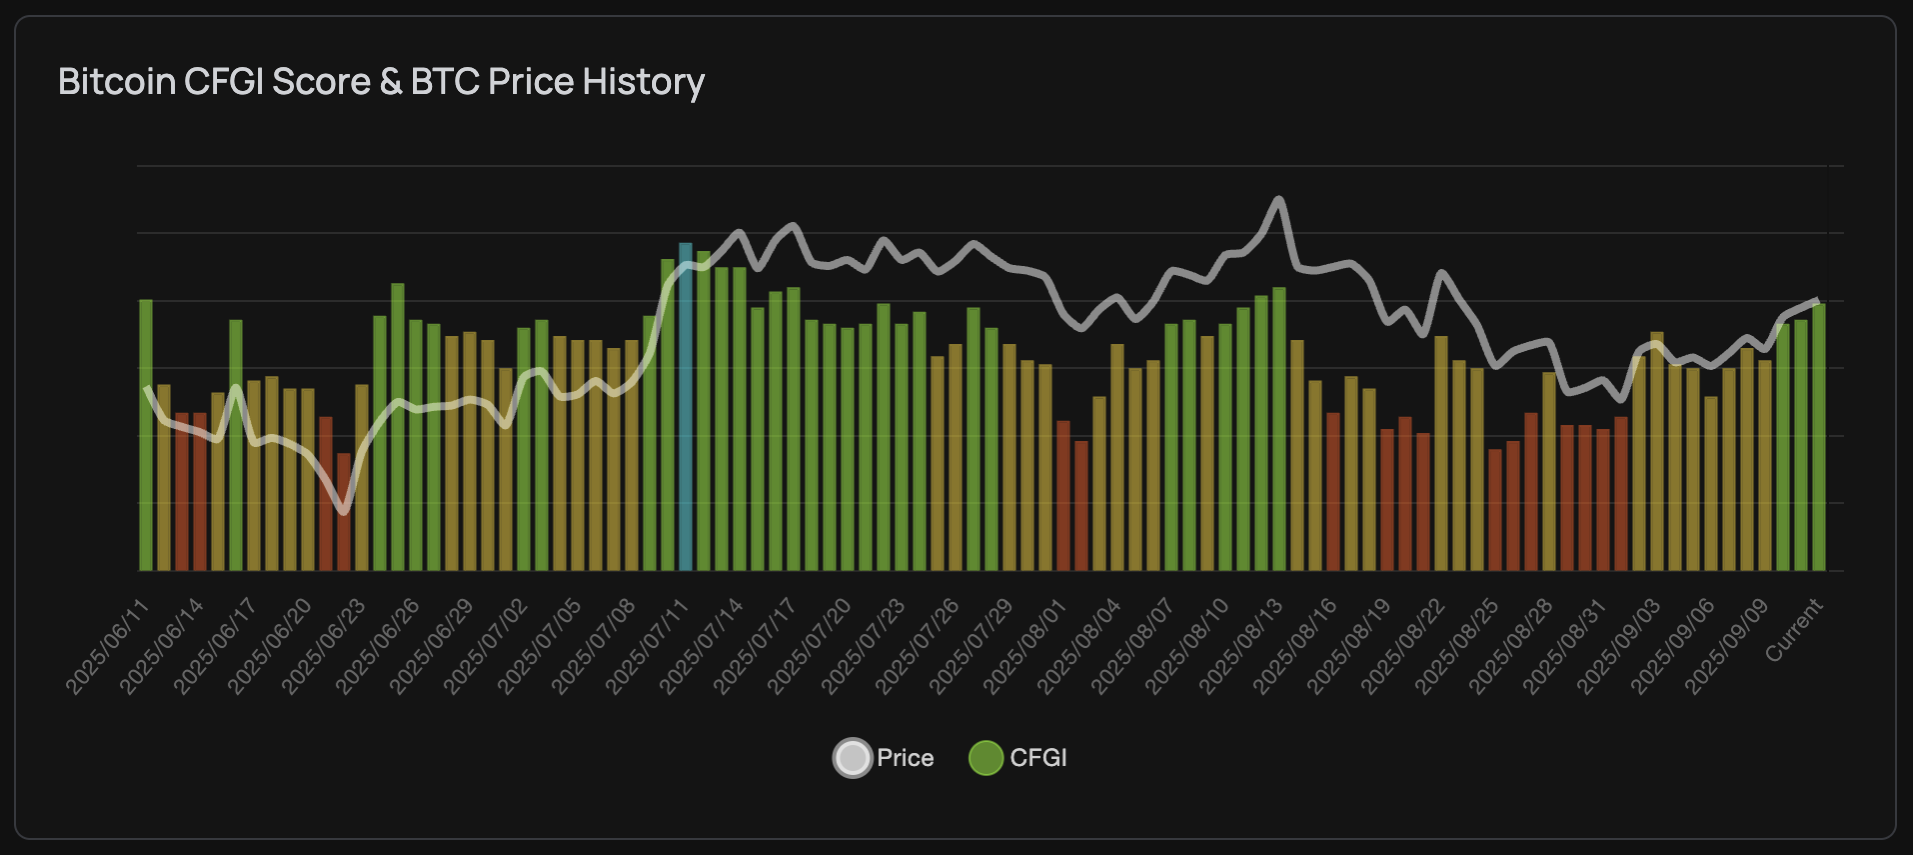
Figure 1: BTC fear & greed index over time. Source: cfgi.io
Analysis of short-term holder wallets (1-6 months) shows that recent buyers are already underwater, with cost bases at $115.6k (1M), $113.6k (3M), and approximately $107k (6M). With Bitcoin trading below these thresholds, these cohorts are experiencing losses. Yet, this has not translated into widespread panic. Market makers will likely continue to apply downward pressure to engineer genuine capitulation. The $107k–$108.9k range represents the final significant support. A breach of this level would open the path to our initial target of $90k–$95k. Historically, bull markets sustain pullbacks of at least 25%; the present 10% dip is insufficient to shake out weak hands.
II. Disconcerting Macroeconomic Signals
A significant divergence is appearing in the equities market, where corporate insiders are liquidating their holdings at an unprecedented rate. In recent weeks, of the hundreds of insider transactions recorded, purchases were conspicuously absent. This wave of selling from the most informed market participants suggests a loss of confidence in current valuations and serves as a potential precursor for weakness in correlated risk assets like Bitcoin.
Furthermore, the bond market is sending a conflicting and cautionary signal. Unlike the bullish reaction in 2024 where yields fell in response to Federal Reserve rate cuts, yields are now climbing into the latest cut. This suggests a growing skepticism among institutional investors about the efficacy of monetary policy. Historically, the initial rate reduction following a tightening cycle often precedes a market downturn. The current divergence, where long-term borrowing costs rise despite the Fed's actions, implies that the central bank's influence is waning.
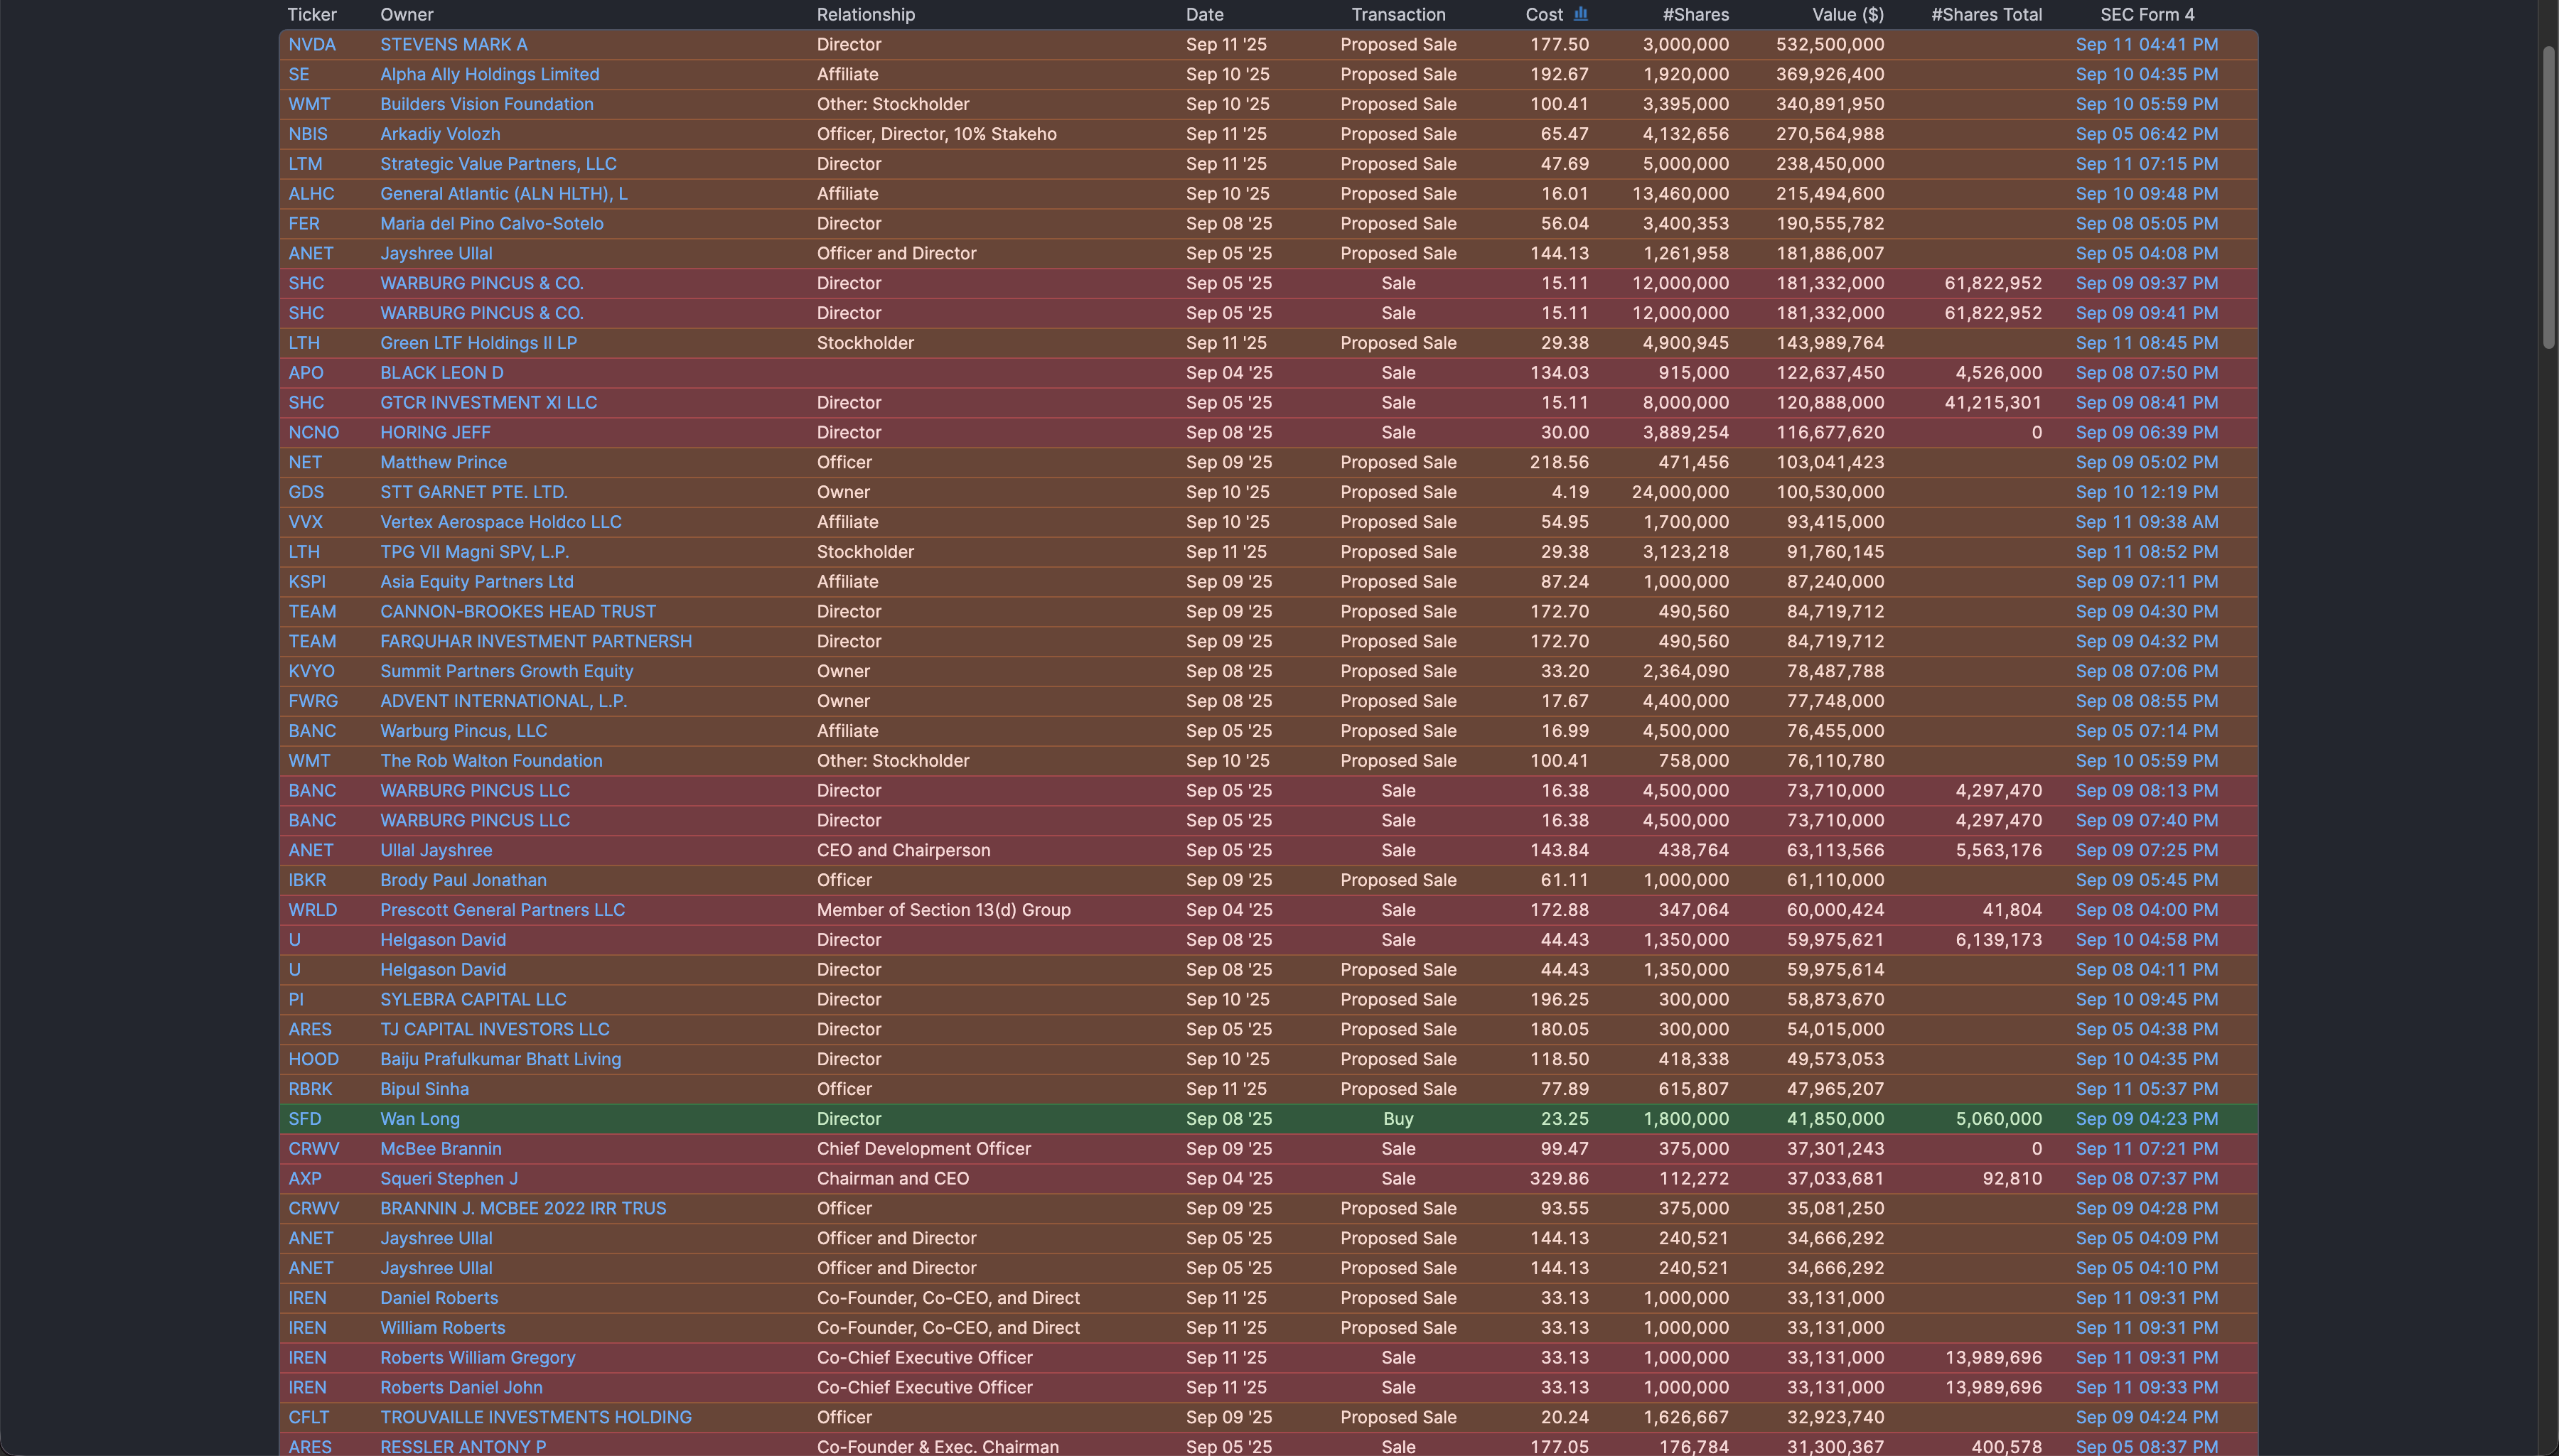
Figure 2: Current insider trading trends. Source: finvis.com
When measured against gold, Bitcoin's performance tells a more nuanced story. Despite reaching a new peak against the US dollar, Bitcoin has failed to surpass its 2021 high relative to gold. This indicates that in real terms, its valuation has remained largely stagnant for three years, with gold demonstrating superior performance. The number of gold ounces required to purchase one Bitcoin remains near 2021 levels, suggesting BTC is at a fair value relative to this traditional store of wealth.
III. The Recessionary Outlook and Strategic Positioning
One of the most reliable long-term economic indicators—the 10-year to 2-year Treasury yield curve—is now signaling a period of maximum risk. Following a historic 784-day inversion, the curve has reverted to a positive spread. Economic precedent is unambiguous: every major recession in the past half-century has occurred *after* this normalization phase. While the preceding inversion was the longest on record, suggesting a potentially extended timeline, the historical window for a market crash is now open and extends through the second quarter of 2026.
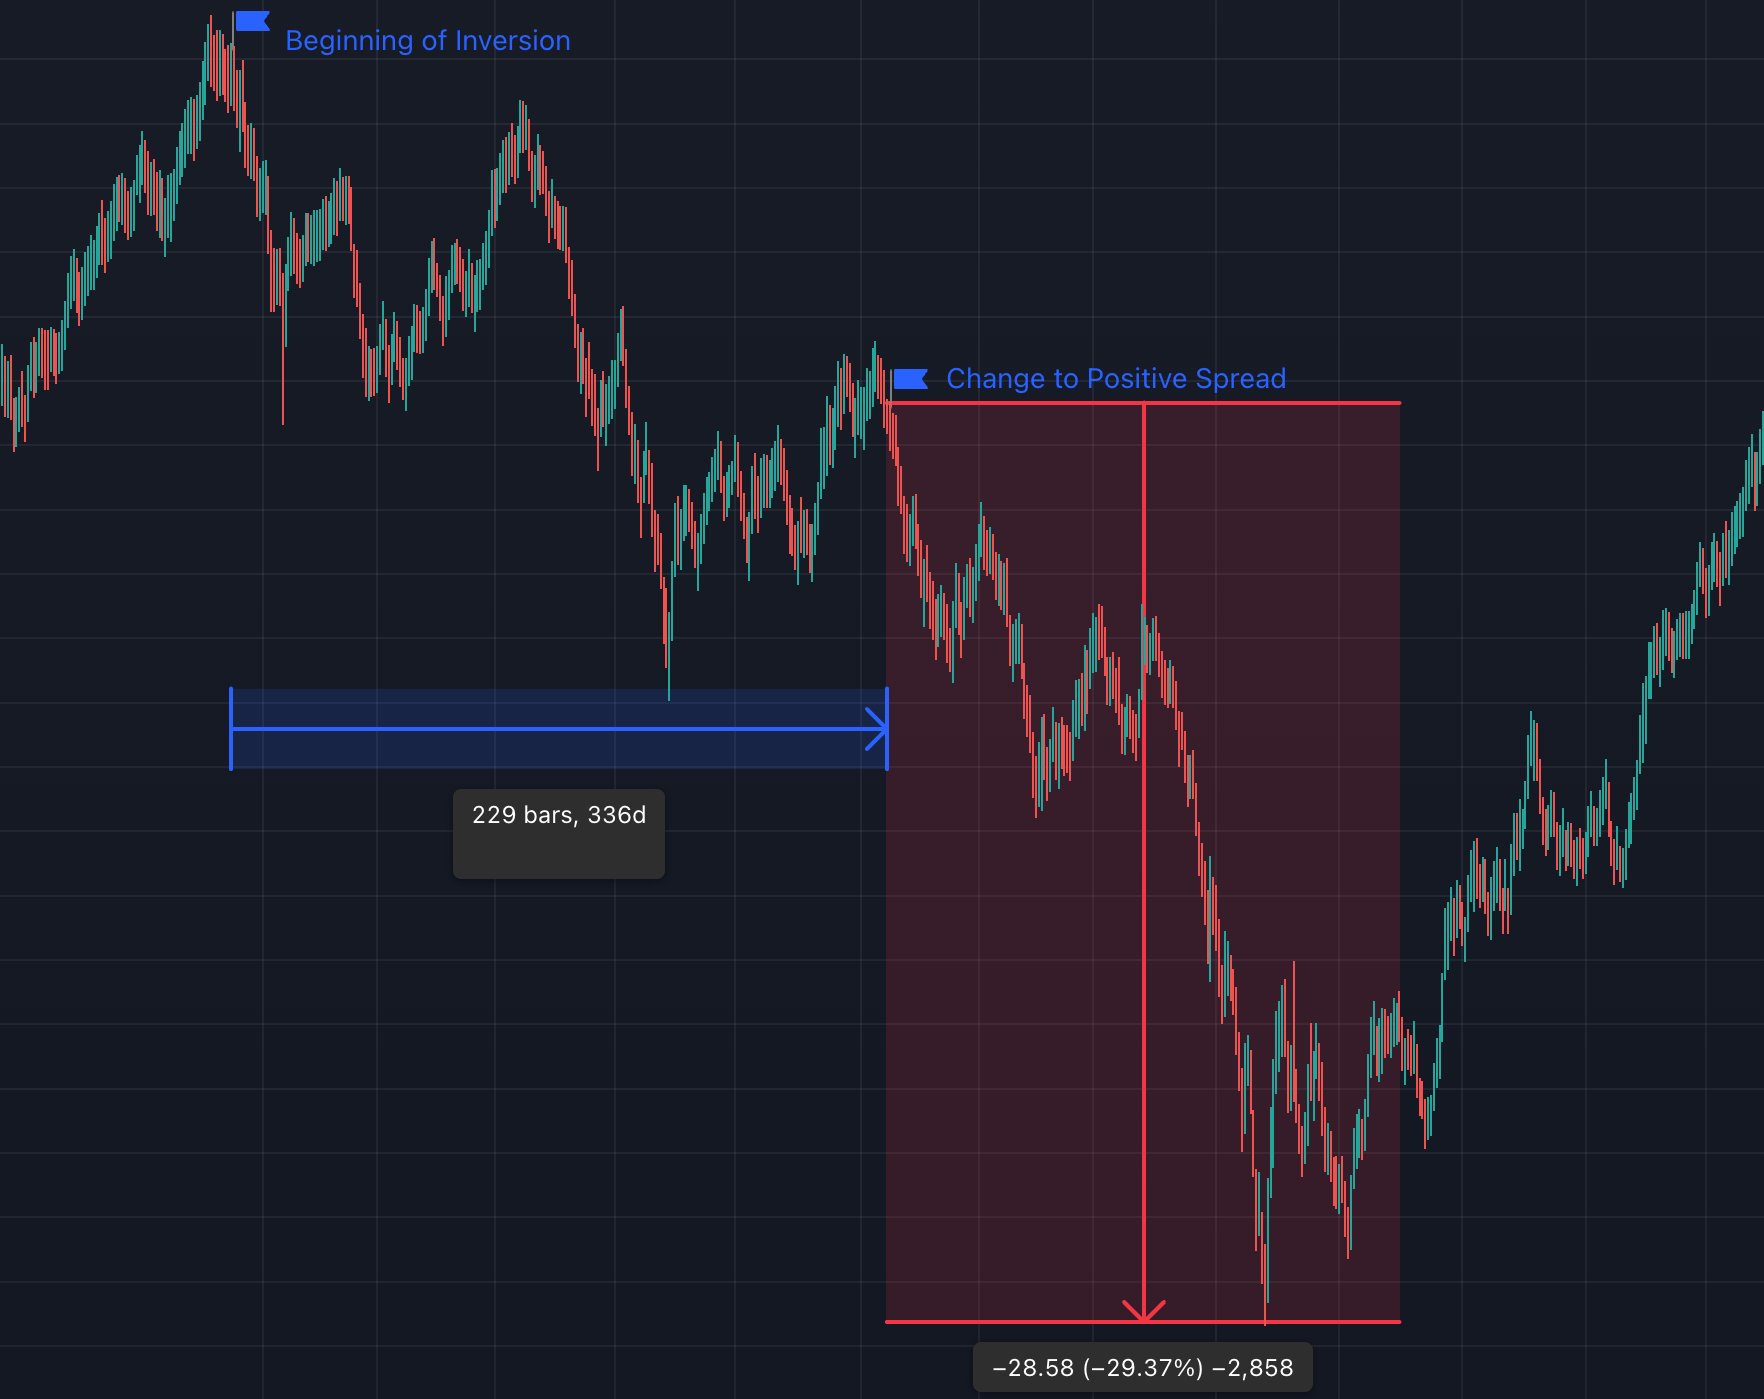
Figure 3: SPX 1969/70 Treasury yeild inversion. Source: tradingview.com
Our primary thesis anticipates a technical correction for Bitcoin towards the $90,000 to $94,000 zone. It is crucial to distinguish this expected pullback from the larger, macro-driven recessionary event that looms on the horizon. Upon reaching this target, market conditions will dictate our subsequent move. Two primary scenarios exist: a relief rally toward the $140,000 level before the broader economic downturn materializes, or an immediate transition into the recessionary leg-down. The period between now and mid-2026 represents a zone of elevated risk, demanding a highly defensive and tactical approach to capital allocation. Imminent economic data releases, including PPI and CPI, will provide further clarity.